by Grady M. Towers
Grady wrote to me Nov 12, 1999:
I was cleaning out some of my files and ran across these three essays (" The Outsiders" "The Empty Promise," and "IQ and the Problem of Social Adjustment"). You may use them however you wish. All have been published and plagiarized many times in the high IQ community. In fact, I believe that "The Outsiders" has probably been the most popular and most plagiarized article I ever wrote.
A couple of requests: First, please don't expect me to correct galleys. You're on your own as far as I'm concerned. If you think that that is too much work, then throw my essays away. I don't care.
Second, you may tell anyone who monitors your website that they have my permission to reproduce or quote from my articles as much as they want. Just tell them to spell my name correctly.
Note from DTM: On July 13, 1999, Grady was a bit more precise on the matter of republishing the material that appears on this website:
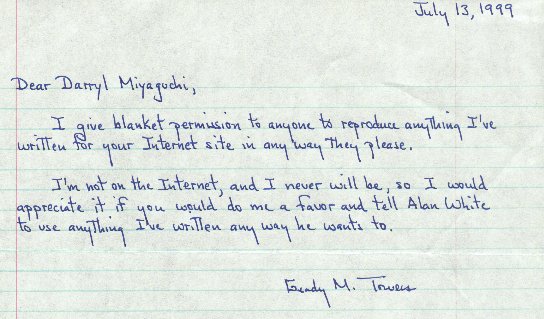
Originally published [?]
In 1921, Lewis M. Terman, by means of teacher selection and multiple testing, identified 1,500 of the most intelligent children in the California school system. His aim was to follow this group of gifted people throughout their lives and observe their achievements in the widest possible sense. He was interested not only in their educational and vocational successes, but also their hobbies, interests, reading habits, health, and many other things.
As children, the Terman group was larger and heavier than the average California child; they matured earlier and their health was better. They averaged one full grade ahead of their contemporaries in grade placement, while at the same time more than half of them had mastered the curriculum a full two or more grades beyond their classmates. There was no evidence that the gifted group was cursed with any compensatory weaknesses, but because they did prefer older playmates and more solitary play, they were sometimes reported by others to be "queer" or "different". Nevertheless, they were not thought to be any more unsociable or unpopular than other children.
As adults, most went on to college and many earned academic distinctions. Delinquency and crime were both below average in frequency, and suicide rates, marriage rates, and age of marriage were the same, or nearly the same as those of the general population. The group's war record, occupational success, and income was clearly superior. By age 35, they had published 90 books and 1,500 articles. By age 45, the group had produced 2,000 scientific papers, 230 patents, and 33 novels, as well as many shorter literary works. All in all, the general picture was one of high scholastic achievement and pronounced occupational success.
Terman entitled his longitudinal research project Genetic Studies of Genius, and quite clearly, this was exactly what Terman expected it to be. But soon the evidence began to mount that IQ was not the index of genius that Terman had first thought. There was no John F. Kennedy, no Robert Oppenheimer, no J.B.S. Haldane, and not even a Henry Ford. Clearly, IQ was the single most important variable ever discovered for the prediction of achievement, but it was just as clear that genius was too elusive to be captured by the IQ net alone.
Finally, in the 39th Yearbook of the National Society for the Study of Education Part I, pp. 83-84, Terman made a most astonishing statement. "Our conclusion is that for subjects brought up under present-day educational regimes, excess in IQ above 140 or 150 adds little to one's achievement in the early adult years." A little farther on he says, "The data reviewed indicate that, above the IQ level of 140, adult success is largely determined by such factors as social adjustment, emotional stability, and drive to accomplishment."
In other word, an extremely high IQ conveys no practical advantages at all.
For a man who had devoted most of his life to the study of gifted people, this was a painful admission for him to make. It is patently obvious that he would not have made it unless he sincerely believed it to be true. But was it true? Was Terman right?
I decided to find out.
The thing to do, it seemed to me, was to reverse Terman's procedure. Find as many intellectually demanding fields as possible, for which there were documented IQ records, and check them for measured intelligence. In other words, use demonstrable, real-world accomplishment as a check against the efficacy of the IQ as a predictor.
I began with a summary of IQs found for doctorates awarded in 1958 (Science, 1961, Vol 133, Jan-Jun, 679-688). The test used for these comparisons was the Army General Classification Test, which has a mean of 100 and a standard deviation of 20. A score of 162 on the AGCT is required for admission to TNS (Vidya #7, Nov 1979).
I also took the liberty of computing an estimate of LAIT equivalent scores as an aid in making comparisons.
Mean and standard deviation of the doctorates for 1958 on the AGCT and the LAIT
                                      AGCT scores              LAIT scores
     Field of doctorate               Mean    S.D.             Mean    S.D.
     Math                             138.2   17.0             130.6   13.6
     Physics                          140.3   16.4             132.2   13.1
     Chemistry                        131.5   16.3             125.2   13.0
     Geology                          133.1   14.7             126.5   11.8
     Engineering                      134.8   16.2             127.8   13.0
        All physical sciences         134.7   16.6             127.8   13.3
        Biological sciences           126.1   16.4             120.8   13.1
        Social sciences               132.0   16.9             125.6   13.5
        Arts and humanities           132.1   16.4             125.7   13.1
        Education                     123.3   16.2             118.6   13.0
     Social sciences, arts, educ      129.8   17.0             123.8   13.6
     Natural sciences                 131.7   17.0             125.4   13.6

     Total                            130.8   17.1             124.6   13.7
The following chart presents the same data in a somewhat different way. Using this format, it's a simple matter to compute percentages falling above or below any given IQ level. For example, more than 70 percent of all doctorates for 1958 had IQs below the 98th percentile. Even in the physical sciences, more than 60 percent fell below the 98th percentile, and only about 5 percent were above TNS admission standards.
Distribution of intelligence test scores for five general fields of the doctorate
and for the total doctorate population
Army Standard  Approx. gen                     Doctorates (N)
 Scale dist    population      All     Phys     Biol     Social   Arts,   Educ-
               age 32, 1958  fields   sciences sciences sciences human.   cation
170-and up           530       46        20        1       15       7        3
160-169            2,670      101        46       11       27      14        3
150-159           12,150      337       153       37       93      35       19
140-149           39,250      530       246       67      112      74       31
130-139          108,000      826       298      150      179     116       83
120-129          218,200      806       243      153      214      89      107
110-119          361,800      520       140      119      106      65       90
100-109          457,400      298        64       79       67      28       60
 90-99           457,400       81        19       19       12       8       23
 80-89           361,800       15         3        4        2                6
 70-79           218,200        7         1        5                1
Below 70         162,600

Total          2,400,000     3567      1233      645      827     437      425
100 (mean)                    130.8     134.7    126.1    132.3   132.1    123.3
No information               4220       931      676      924     771      918
Terman's statement was based on data provided by the Stanford-Binet. As the remainder of the IQs in this paper will be based on the Wechsler-Bellevue (W-B), or the Wechsler Adult Intelligence Scale (WAIS), it's important to know that Stanford-Binet IQs are typically found to be 10 to 12 points higher than Wechsler-Bellevue scores. In fact, "...the difference between the Revised Stanford-Binet and the Wechsler-Bellevue IQs become progressively greater the higher the IQs are above 100." (Jour of psych XIV, 1942, 317-326. See also Jour of Consul Psych 25, 10 61, 390, and the Jour of Social Psych XXIII, 1946, 237-239) This should not be construed to mean that the Stanford-Binet is less valid than the Wechsler-Bellevue, the Wechsler Adult Intelligence Scale, or any other highly reliable test. In fact, the Stanford-Binet may be somewhat more valid at the very highest levels. All that it does mean is that the level of performance represented by a score on the W-B, or the WAIS, will be represented by a score 10 or 12 points higher on the Stanford-Binet. At the very highest levels this difference will be even greater.
One of the most outstanding groups of men that I was able to find was that of the faculty of the University of Cambridge. (Nature, 1967, 213, 442) These scores represent the Full Scale WAIS IQs of 148 faculty members in a variety of disciplines from one of the most distinguished Universities in the world.
The WAIS has a mean of 100 and a standard deviation of 15. Entrance requirements to TNS on the WAIS is a score of 148 (Vidya #7, Nov 1979)
Mean, range, variance, and standard error of the mean, for 148 Cambridge faculty
                                     Mean        Range of               Standard
Subject of                          deviation     scores    Variance    deviation
bachelor degree            n           IQs                             of the mean
Agricultural sciences     17          121.6       110-135     41.18       1.55
Biochemistry              10          130.0       122-141     41.33       2.034
Biological sciences       20          126.1       113-135     27.05       1.15
Chemistry                 12          129.6       121-138     30.45       1.59
Engineering sciences      16          125.0       111-138     57.46       1.9
Mathematics               16          130.4       124-136     16.0        1.0
Medical sciences          10          127.0       116-134     46.22       2.15
Physics                   20          127.7       112-136     39.05       1.4
Social sciences           10          121.8       112-132     41.55       2.04
"The scores range from 110 to 141 with a mean of 126.5 and a standard deviation of 6.3 points. All the scores fall within three standard deviations of the mean. The distribution of the scores in terms of Wechsler's classification show that all the scientists obtained scores above the seventieth percentile rank for the general population -- 35.2 per cent are classified as "very superior", 51.3 per cent as "superior", and 13.5 per cent as "bright normal". Approximate percentages of these three groups in a general population sample are 2.2, 6.7, and 16.1 respectively."
     The following chart is taken from Wechsler's Measurement and Appraisal of
Adult Intelligence by Joseph D. Matarazzo, 5th edition, p 177.

                                        XX
                                      X XX  X     X
                                      X XX  X   X X
                                   X  X XX  X X X X
                                   XXXXXXX  X XXXXX   X
                                  XXXXXXXX XXXXXXXXX XX
                           X     XXXXXXXXXXXXXXXXXXXXXX  X           X
               |          |          |          |          |          |
              100        110        120        130        140        150

     The Full Scale WAIS IQs for 80 medical students.  Adapted from Kole, D. M.
A study of intellectual and personality characteristics of medical students.
(The Journal of Medical Education, 1965, 40, 1130-1143)
"...for individuals in a profession known to require high intellectual prowess there is, nevertheless, a wide variability around the median IQ of 125.5. The actual range of Full Scale IQ on the WAIS for these young physicians is from a low of 111 (77th percentile) to a high of 149 (99.9th percentile).
Matarazzo goes on to say, "Another point which is well understood among the few currently growing group of specialists in this country who deal primarily with the assessment of individuals applying for entry into medicine, law, graduate nursing, physics, economics, psychology, English literature, graduate business school, and a host of related scientific and humanistic disciplines is that, on the basis of a purely intellectual index, such applicants are so similar as to have come from the same population.
Currently practicing physicians are also similar to these young medical students in Full Scale WAIS IQs. (Matarazzo and Goldstein, Journal of Medical Education, 1972, 47, 102-111)
Holt and Luborsky in Personality Patterns of Psychiatrists, 1958, p. 40, reported that the "Average Wechsler-Bellevue Scale of Adult Intelligence was 128" ... "Scores ranged from 110 to 145. IQ was not decisive in gaining admittance; the average of those accepted was only slightly higher than those who were rejected. The average verbal subscore was 131 with a range of 115-145."
Balinsky and Shaw (Personnel Psychology, 1956, 9, 207-209) reported on an appraisal of top level executives a Full Scale IQ of 124.09, S.D. 7.90; Verbal Scale IQ 125.1, S.D. 8.09; and Performance IQ 117.09, S.D. 9.81. They also reported that only the Verbal IQ was significantly correlated with performance ratings (r = .32, p<.05). However, the subscale of arithmetical reasoning proved to be the best predictor of management performance (r = .42, p<.01).
Up to this point I have tried to avoid using data from less demanding vocations. But because the article by L.M. Simon and E.A. Levitt (Occupations, 1950, 29, 23-25) is the most extensive set of norms I've ever seen in one place for the W-B, I've decided to include their full table.
        SCORES ON THE WECHSLER BELLEVUE SCALE IN RELATION TO OCCUPATION
     Group             N         Range     10%   Q-1   Median    Q-3     90%
Engineers             52
    Full                        116-148    121   127     133     135     140
    Verbal                      110-144    120   125     130     136     140
    Performance                 114-145    119   124     129     133     137
Professionals I       52
    Full                        113-141    120   126     132     134     137
    Verbal                      109-144    121   126     134     136     141
    Performance                  99-137    115   119     124     129     132
Educators             45
    Full                        104-141    118   123     129     134     137
    Verbal                      106-143    112   123     129     134     137
    Performance                  95-139    112   117     125     132     135
Professionals II      61
    Full                        106-143    117   123     128     133     138
    Verbal                      112-143    117   123     128     132     137
    Performance                  94-141    111   118     124     129     136
Teachers             421
    Full                         94-152    114   120     126     132     137
    Verbal                       94-145    113   120     126     131     137
    Performance                  83-161    108   115     123     130     134
Social Service        66
    Full                        108-145    117   121     125     132     135
    Verbal                      105-145    114   118     124     133     136
    Performance                  95-146    106   113     122     129     134
Managers             134
    Full                         92-146    113   120     125     130     136
    Verbal                       81-140    110   118     124     131     135
    Performance                  91-154    109   115     122     129     135
Nurses               191
    Full                         93-141    113   118     124     128     132
    Verbal                       99-143    110   115     121     127     131
    Performance                  78-145    102   114     125     130     136
Arts                  62
    Full                         74-147    109   117     124     131     138
    Verbal                       73-142    107   115     120     127     136
    Performance                  78-145    102   114     125     130     136
Sales                153
    Full                         95-142    105   112     122     128     132
    Verbal                       93-143    101   111     120     128     133
    Performance                  93-144    103   111     118     125     130
Secretaries          107
    Full                         92-135    108   114     121     125     130
    Verbal                       94-134    107   114     120     125     130
    Performance                  88-136    102   108     118     126     129
Bookkeepers           55
    Full                         99-137    105   109     117     125     129
    Verbal                       98-141    102   107     115     125     129
    Performance                  94-141    101   107     114     120     125
Clerks               128
    Full                         74-140     97   105     116     122     131
    Verbal                       76-145     99   106     117     122     127
    Performance                  69-140     94   103     114     121     129
Office Workers        62
    Full                         88-139     99   108     116     123     128
    Verbal                       89-135     98   104     113     122     127
    Performance                  81-141     97   106     115     124     128
Skilled Labor        107
    Full                         87-139    103   110     115     123     127
    Verbal                       82-136     98   106     114     120     127
    Performance                  93-136    102   108     117     122     126
Personal Service      57
    Full                         54-130     79    92     106     113     122
    Verbal                       59-132     80    90     104     115     121
    Performance                  54-129     84    99     105     114     119

Professionals I -- physicians, dentists, lawyers
Educators -- college deans and instructors, high school and grammar school principals
Professionals II -- pharmacists, accountants
Social Service -- social workers, clergy
Managers -- small business owners, retail store managers, office managers, foremen
     business executives, small manufacturers.
Arts -- singers, dancers, musicians, actors, artists, designers, commercial artists
Sales -- all inside and outside sales people, wholesale and retail
Office Workers -- stenographers, comptometer operators, typists, receptionists,
     telephone switchboard operators
Skilled Labor -- machinists, automobile and aircraft mechanics, radio and television
     repairmen, plumbers, electricians
Personal Service -- barbers, beauticians, waiters, food handlers, soda fountain
     attendants, domestics
I included this particular reference because there were enough high level professions included in the table to make it of interest to my topic. Readers who are interested in similar scores for a very much larger range of occupations are referred to the Army General Classification Test scores from World War II. most of that data is not based on intellectually demanding occupations and is not included in this paper for that reason.
Just after World War II, Dr. G.M. Gilbert, a psychologist-psychiatrist, was given access to the prisoners who were to be put on trial for war crimes at Nuremberg. Included in his examination was a German version of the American Wechsler-Bellevue Adult Intelligence Test. The results of those tests, presented in the table below, may be found in Dr. Gilbert's book, Nuremberg Diary, and also in The Reich Manual, p. 363, by Leonard Mosley.
                      Name                          IQ
                      1. Hjalmar Schacht            143
                      2. Arthur Seyss-Inquart       141
                      3. Hermann Goering            138
                      4. Karl Doenitz               138
                      5. Franz von Papen            134
                      6. Erich Raeder               134
                      7. Dr. Hans Frank             130
                      8. Hans Fritsche              130
                      9. Baldur von Schirach        130
                     10. Joachim von Ribbentrop     129
                     11. Wilhelm Keitel             129
                     12. Albert Speer               128
                     13. Alfred Jodl                127
                     14. Alfred Rosenberg           127
                     15. Constantin von Neurath     125
                     16. Walther Funk               124
                     17. Wilhelm Frick              124
                     18. Rudolf Hess                120
                     19. Fritz Sauckel              118
                     20. Ernst Kaltenbrunner        113
                     21. Julius Streicher           106
It's interesting to speculate on what Adolf Hitler's IQ might have been. I think we're on pretty safe ground in saying that he must have been at least as bright as the top members on this list. If he hadn't been, these wolves would surely have torn him apart.
TNS accepts a WAIS score of 148 for admission, but does not accept Wechsler-Bellevue scores (Vidya #7, Nov 1979). However, if TNS did accept such scores, the admission requirement would be about 143. The W-B has a standard deviation of about 14 points. This places the median score (129) of the Nazi leaders just above the 98th percentile, and the highest scoring of the group just below TNS admission requirements.
It's also interesting to not that Dr. Gilbert was one of Terman's research subjects. He can be easily identified from the clues offered on page 365 of The Gifted Child Grows Up (5th edition, 1976).
The evidence presented so far supports two conclusions. First, that practical success in even the most intellectually demanding professions, such as scientist, professor, physician, or high level executive requires an intelligence quotient no higher than the 96th percentile (125 WAIS). Second, that even in these demanding professions, there is a broad range of ability. Some doctorates were even awarded to individuals with IQs below 100, although this was rare.
It may have occurred to the reader that the surprisingly low showings may be the result of insufficient ceiling on the tests cited. Unfortunately, this is not the case. Neither the WAIS nor the W-B were designed to measure into the stratosphere of human ability, it's true, but the means and medians cited were all more than a standard deviation below test ceilings. The AGCT has an even higher ceiling than the WAIS or the W-B. Consequently, the average IQ of 125 can't be interpreted as an artifact of the measurement process.
It may also have occurred to the reader that a moderately low minimum IQ for the professions still doesn't imply that a 160 IQ isn't a better indicator of potential success than a 125 IQ. Unfortunately, the evidence indicates that, while IQ does count for something above 125, it doesn't count for much in terms of practical success.
The strongest and most easily understood evidence for this conclusion comes from the Terman study itself. Terman divided 750 of his subjects into three groups which he called A, B, and C. The A subjects were the most successful members of his group, and the C subjects were his least successful. These evaluations were made by three judges whose primary criterion was the extent to which a subject made use of his superior intellectual ability. Professional recognition counted heavily, but earned income was discounted even in evaluating businessmen. There were 150 subjects in the A and C groups, and the remainder were in the B group.
The A group included all those subjects listed in Who's Who or American Men of Science, teachers above the rank of university instructor, those outstandingly successful in law, medicine, engineering, business, and some of those successful in literature, art, and motion pictures.
The C group was not composed exclusively of failures by any means. In fact, by ordinary standards most of these men could not be considered failures at all. Nevertheless, they were subjects that had failed to live up to their potential. Some were classed as professionals or semi-professionals, but a large number were in skilled trades, clerical and minor business positions, and some were policemen or firemen. Although there were more of the mentally and socially maladjusted among the Cs, there were also many who were well adjusted and contented. Often the difference between a C and an A was nothing more than level of aspiration.
The most important fact for our purpose is that the childhood IQs of these two groups differed by only five points. The adult differences in Concept Mastery Test score (form A) was 18.3 raw score points. Both differences are highly significant statistically, but are too small in either case to be of any practical importance. In short, there was no important difference in intelligence between Terman's most successful subjects and his least successful ones.
The ineffectiveness of IQs above 140 can also be corroborated by a host of correlation studies. Unfortunately, this data is not easily tabulated, and a summary of the results depends upon the reader's understanding of the statistical phenomena of range restriction. Rather than present a tedious mathematical analysis, it seems better to me to sketch an easily understood analogy, and then to draw the obvious parallels.
Suppose that you wished to predict how well potential basketball players would perform. Among the things that you would look for would be players' physical heights. One could say with near certainty that a player who was seven feet tall would perform better than a potential player who was only five feet tall. We would expect the correlation between players' heights and measures of player's effectiveness to be quite high, perhaps .8 or .9. This correlation is, of course, computed from the full range of potential players' heights.
Now, suppose we selected players from only the very tallest candidates. Suppose we selected only those that were at least six foot six. We would find that the seven foot player's performance, when compared with a player who was only six foot six, would not necessarily be superior. Other factors now begin to have overriding importance: who is better motivated, faster, more accurate, etc. The six foot six player could easily turn out to be the better player. Moreover, the correlation between height and player effectiveness has now shrunk to, say, .3 or .4. This shrinkage of the correlation coefficient is the mathematical consequence of shrinkage in range; this is the phenomenon of range restriction.
In a similar way, when only those at the very top of the IQ spectrum are selected out for some intellectually demanding task, the predictive power of the test will be less. If two young men both graduate from medical school at the same time, one with an IQ of 125 and an undistinguished academic record, and the other with an IQ of 160 and a brilliant record, we would have no way of knowing who would be the more successful physician ten years later. Other factors would have assumed overriding importance: things like good bedside manner, good health, connections, specialty, ambition, etc. The more gifted physician would have an edge in the comparison, but it would be a very slight edge.
In almost every investigation of IQ with real world performance, two conclusions almost always stand out. First, the correlation of IQ with training criteria (grades, credentials, teacher evaluations, etc.) is almost always higher than with performance on the job. This is another example of range restriction. Training often depends heavily on what IQ tests measure, but performance on the job also depends on personality traits, and special abilities, with IQ becoming less important.
The second finding is that IQ does correlate with performance on the job; correlations being near zero in menial jobs, and about .3 to .5 in the most intellectually demanding jobs. But even here, the strength of the correlation coefficients aren't very impressive, and other, more personal traits can be expected to be of more practical importance than measured intelligence. In fact, E.E. Ghiselli says, "The correlation between IQ and job success in a given occupation is only about .20; this should be compared with the correlation of .50 typically found between IQ and occupational attainment -- taking into account different occupations."
In short, after job training or formal education, IQs become relatively ineffective predictors of success.
For the reader who is interested in the subject of predicting job performance by means of IQ and other kinds of tests, I highly recommend E.E. Ghiselli's book, The Validity of Occupational Aptitude Tests, New York; Wiley, 1966.
The strongest, clearest, and most comprehensive summary of all these research finding can probably be found in A.R. Jensen's book, Bias in Mental Testing, 1980, p. 113.
"Although IQs are an interval scale, the practical, social, economic and career implications of different IQs most certainly do not represent equal intervals. Again, this is not a fault of the IQ scale, but is the result of personal and societal values and demands. The implications and consequences of, say, a 30-point IQ difference is more significant between IQs of 70 and 100 than between IQs of 130 and 160. The importance of a given difference depends not only on its magnitude, but on whether or not it crosses over any of the social, educational, and occupational thresholds of IQ. To be sure, these thresholds are statistical and represent only differing probabilities for individuals' falling on either side of the threshold. But the differential probabilities are not negligible. Such probabilistic thresholds of this type occur in different regions of the IQ scale, not by arbitrary convention or definition, but because of the structure of the educational and occupational systems of modern industrial societies and their correlated demands on the kind of cognitive ability measured by IQ tests.
The four socially and personally most important most important threshold regions on the IQ scale are those that differentiate with high probability between persons who, because of their level of general mental ability, can or cannot attend a regular school (about IQ 50), can or cannot master the traditional subject matter of elementary school (about IQ 75), can or cannot succeed in the academic or college preparatory curriculum through high school (about IQ 105), can or cannot graduate from an accredited four-year college with grades that would qualify for admission to a professional or graduate school (about IQ 115). beyond this, the IQ level becomes relatively unimportant in terms of ordinary occupational aspirations and criteria of success. That is not to say that there are not real differences between the intellectual capabilities represented by IQs of 115 and 150 or even between IQs of 150 and 180. But IQ differences in this upper part of the scale have far less personal implications than the thresholds just described and are generally of lesser importance for success in the popular sense than are certain traits of personality and character.
The social implications of exceptionally high ability and its interaction with the other factors that make for unusual achievements are considerably greater than the personal implications. The quality of a society's culture is highly determined by the very small fraction of its population that is most exceptionally endowed. The growth of civilization, the development of written language and of mathematics, the great religious and philosophic insights, scientific discoveries, practical inventions, industrial developments, advancements in legal and political systems, and the world's masterpieces of literature, architecture, music and painting, it seems safe to say, are attributable to a rare small proportion of the human population throughout history who undoubtedly possessed, in addition to other important qualities of talent, energy, and imagination, a high level of the essential mental ability measured by tests of intelligence."
Terman was right; an IQ above 140 has very little significance in terms of personal success. But if Jensen's assessment is correct, and I am confident that it is, where were the historical personages that should have emerged from Terman's study?
Terman suffered badly from halo effect He not only exaggerated the importance of IQ, he also inflated test scores. All of his subjects were chosen as children of approximately 11 years of age. Their childhood IQs were reported to be 152, but Quinn McNemar reported their adult IQs to be only 134, 18 points less than their childhood scores (The Gifted Child Grows Up, p. 146). Yet adult IQs were avoided as often as possible in reporting adult achievements; childhood IQs were preferred in every case. Other investigators making use of Terman's data almost always follow this practice as well. Consequently, a myth has grown up reflecting a superiority that Terman's group did not in fact possess.
Terman also selected members of his group with IQs above 170 (average 177.7 men and 177.6 women) for special study. If we subtract the same 18 point difference from 170 that we found between childhood IQs and adult IQs in the main group, we will arrive at an estimate of 152: an estimate less than the TNS average of 156. But even 152 is an overestimate for two reasons. First, the farther a score is from the mean, the greater the regression to the mean will be: 18 points is an underestimate. Second, Terman says specifically that an IQ of 170 is found about 3 times in 10,000 of the general population (The Gifted Child Grows Up, p. 282). That's 3.43 sigma according to my tables, or about 155 IQ, before the 18 or more points are subtracted to allow for adult regression. The average TNS member is at least the equal of Terman's high group, and may very well be their superior.
Nevertheless, Terman's "Subjects of IQ 170 or Above" is the only group that I'm aware of that comes close to furnishing a picture of what TNS members are probably like.
Jensen's reference to the social implications of exceptionally high IQs suggests that intellectual achievements on an historical scale will be made only by those of very rare ability indeed. Can we find such achievements and measure the IQs of those who made them? Indeed we can. In fact, it's already been done. In the early 1950s, Doctor Anne Roe wrote a book titled The Making of a Scientist (Greenwood Press, Westport Conn, 1973) in which she investigated the biographies, personalities, and intellectual abilities of 64 of America's most eminent living scientists, some of whom were Nobel Prize winners. She found the average verbal IQ of this very eminent group to be 166 (p. 164). These scientists comprise the only research group I've come across whose intellectual abilities resemble those of the Four Sigma Society.
CODA
If IQs above 140 have little importance for personal achievement, what then is left for us? Jensen says, "The evidence is overwhelming that scholastic achievement increases linearly as a function of IQ throughout the entire range of the IQ scale..." (Bias in Mental Testing, p. 319). In other words, what's left for us is knowledge. We are the ones who learn, who understand, who discover, and who invent. That should be ample challenge for any of us.
![]()